Ad-Hoc Summary Reports: Grouping
Purpose
- This article demonstrates uses cases and provides an overview of grouping options available within a Summary Ad-Hoc report.
- Summary Reports Grouping is in beta phase. The First Due Team will be making quick and frequent updates to this feature based on customer feedback and performance.
Videos
Information
- Grouping Options within Summary Reports allow agencies the ability to visualize data custom to their individual reporting needs.
- Grouping Options allow agencies to:
View Trends over Time
Group Information into Custom Charts
Visualize Progress Towards a Benchmark or Standard
How to Use Grouping Options
Start the Ad-hoc Report like any other. Fill out the Basic Information section and select a data source. Choose the Summary report type. If applicable, apply report criteria. Then, navigate to Grouping.
Grouping Tools
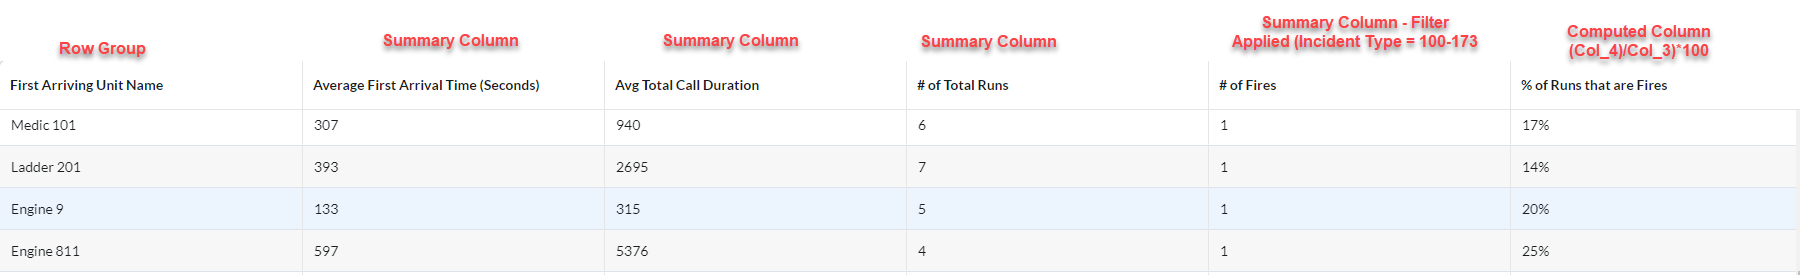
Rows: The row group defines the primary field being summarized in the report. Choosing the row group will allow the user to apply columns in the next steps. The Row Groups are boxed in red in the following examples:
Columns:
There are two types of columns a user can create: Summary and Computed.
Summary Columns are used to define fields that should be counted, averaged, summed, etc. in relation to the row group. Every report needs at least one summary column. Use the  icon to add additional columns.
- For each Summary Column:
- Select the Measure
- Define the field for aggregation. The fields available for selection depend on the data source being used as well as the row group selected.
- Define any filter conditions for the specific column. In this example, the filter conditions are used to eliminate potential outliers:
- The resulting column in the example used here would look like this:
Computed Columns can only be added after one or more summary columns are created. Computed Columns are used to add, subtract, divide, or multiply summary columns against a value or each other. Add additional computed columns using the  icon.
icon.
- Enter the desired formula in the box provided using placeholders.
- To use a placeholder, select the desired column from the placeholder dropdown list. The list of available placeholders reflects the different summary columns added to the report. For each column, there are two choices:
- "col_[x]" is used to measure each data point within a column.
- Example: (col_1)+(col_2)
-
- "col_[x]_total" is represents the sum of an entire column.
- Example: (col_1)/(col_1_total)*100
- Each summary column will display its alias right below the allowed decimal place field. Use the alias to select the column as a placeholder.
- Use the following keys to apply arithmetic functions to the columns:
- Then name the column and define the value format. If needed, define the allowable decimal places. Here are some examples:
- In this example, the computed column is being used to divide a data source of time in seconds into minutes:
- The resulting computed column looks like this:
- Here's another example of a computed column. In this example, the column is being used to add two summary columns (columns 1&2). Column 1 represents BLS dispatch types and Column 2 represents ALS dispatch types. The computed column provides a total.
- In this example of a computed column, the column is being used to calculate a percentage complete by dividing column 1 (completed inspections) by the total of columns 1&2 (total inspections) and multiplying by 100. Note the Value format selected is "percentage".
Example: Combining Summary Columns & Computed Columns
Column Groups
Column Groups are can be used to separate a single data source field (column) into groups.
- In this example, summary column 1 is being used to count the number of incidents (column) for each dispatch type (row):
- The Column Group is then used to sort the count of incidents by year:
- The result looks like this:
Adding a Chart
Users have the option of adding a chart when creating a summary report. Use the chart to visualize data defined in the row group against another field (column for aggregation).
- 1) Choose the chart type
- 2) Select the chart grouping. Available fields to group are defined by the row group or column group in the table.
- 3) Select the appropriate measure and the field to be measured (column for aggregation)
-
Examples of Charts:
1) Incident Count Year over Year
2) Incidents Last 48 Hours
In this example, report criteria is used in addition to defining the chart. The report criteria narrows down the data to only the last 48 hours.
Associating Reports with the Dashboard Module
Charts can be viewed inside the Dashboard Module after being constructed within Ad-Hoc reporting. The information in the charts and reports is updated each time the dashboard is accessed or refreshed. For more information: refer to this article: Associating Reports with a Dashboard
Related Articles
First Due Reports (FDR)
Purpose: To illustrate the function and use case of First Due Reports (FDR). Information: First Due Reports live within Ad-hoc Reporting, and are created by the First Due Reporting Team. FDR are organized by module and searchable by module within ...Ad Hoc Reporting: Creating a Summary Ad-Hoc Report
Purpose To explain how to create a Summary Ad-Hoc report. Video Directions Navigate to Reports > Reports. Click at the top of the screen. We will now begin creating a summary report section by section. Basic Information Create a name for the report. ...Inspection Record - Ad Hoc Violations
Purpose To demonstrate how to add Ad Hoc Violations to an Inspection Checklist. An Ad-Hoc Violation is a feature to add a violation to the Checklist that is not contained within the current Checklist. Video Instructions Note: Ad-Hoc Violations must ...Frequently Asked Questions- Reports
What is the difference between Ad Hoc and the other module-specific (aka “canned”) reports? Ad Hoc is a framework for creating customized reports around specific requirements and data sources. Canned reports provide a pre-built solution for common ...Ad-Hoc Reports: Data Source Configuration
Purpose To explain how Fire Department users can select the data sources for their Ad-Hoc Reports. Video Directions 1. Select the Data Source Configuration tab 2. Select the Data source from the drop-down menu 3. The drop-down menu will allow you to ...